


Apache Lucene is one of the most important pieces of search software almost nobody installs directly.
Doug Cutting wrote it in 1999 and released it on SourceForge in 2000. It joined the Apache Jakarta project in 2001 and became a top-level Apache project in 2005, so the codebase has been under continuous development for a quarter of a century. Today Elasticsearch, OpenSearch and Solr are all Lucene wearing different clothes, Azure AI Search and MongoDB Atlas Search are Lucene you rent by the hour and Neo4j, CrateDB and SingleStore are databases that quietly embed it. On DB-Engines the search engine category is, with very few exceptions, a list of things built on one Java library. I first tried Lucene in 2012 and it became my personal inspiration point since then.
We have already published SereneDB against ArangoDB, which measured us against our own earlier work because our team built ArangoSearch and against the Postgres family, which mattered because SereneDB is Postgres compatible and we wanted to know what we add to that ecosystem.
This time we wanted to put SereneDB against search specialists. Elasticsearch, OpenSearch and CrateDB all run the library I have been measuring my own work against since 2012. So we took Elasticsearch 9.5, the same Elasticsearch in its brand new columnar index mode, OpenSearch 3.8 and CrateDB 6.4, put them on one box next to SereneDB and asked all of them the same 92 questions over the same 100M and 1B OpenTelemetry logs.
TL;DR
If you only want just the numbers first. At a billion OpenTelemetry logs, 92 queries, 60 second cap, hot median latency:
| engine | median latency | finished | on disk |
|---|---|---|---|
| SereneDB | 32.5 ms | 92 of 92 | 112.1 GiB |
| Elasticsearch 9.5 | 98.4 ms | 88 of 92 | 153.2 GiB |
| Elasticsearch 9.5 columnar | 189.2 ms | 90 of 92 | 112.0 GiB |
| OpenSearch 3.8 | 195.2 ms | 83 of 83 | 136.5 GiB |
| CrateDB 6.4 | 543.5 ms | 81 of 92 | 190.5 GiB |
- 1B logs
- 100M logs
Full results are at serenedb.com/searchbench and the benchmark itself lives at github.com/serenedb/searchbench.
Chapter 1. How the search library market formed
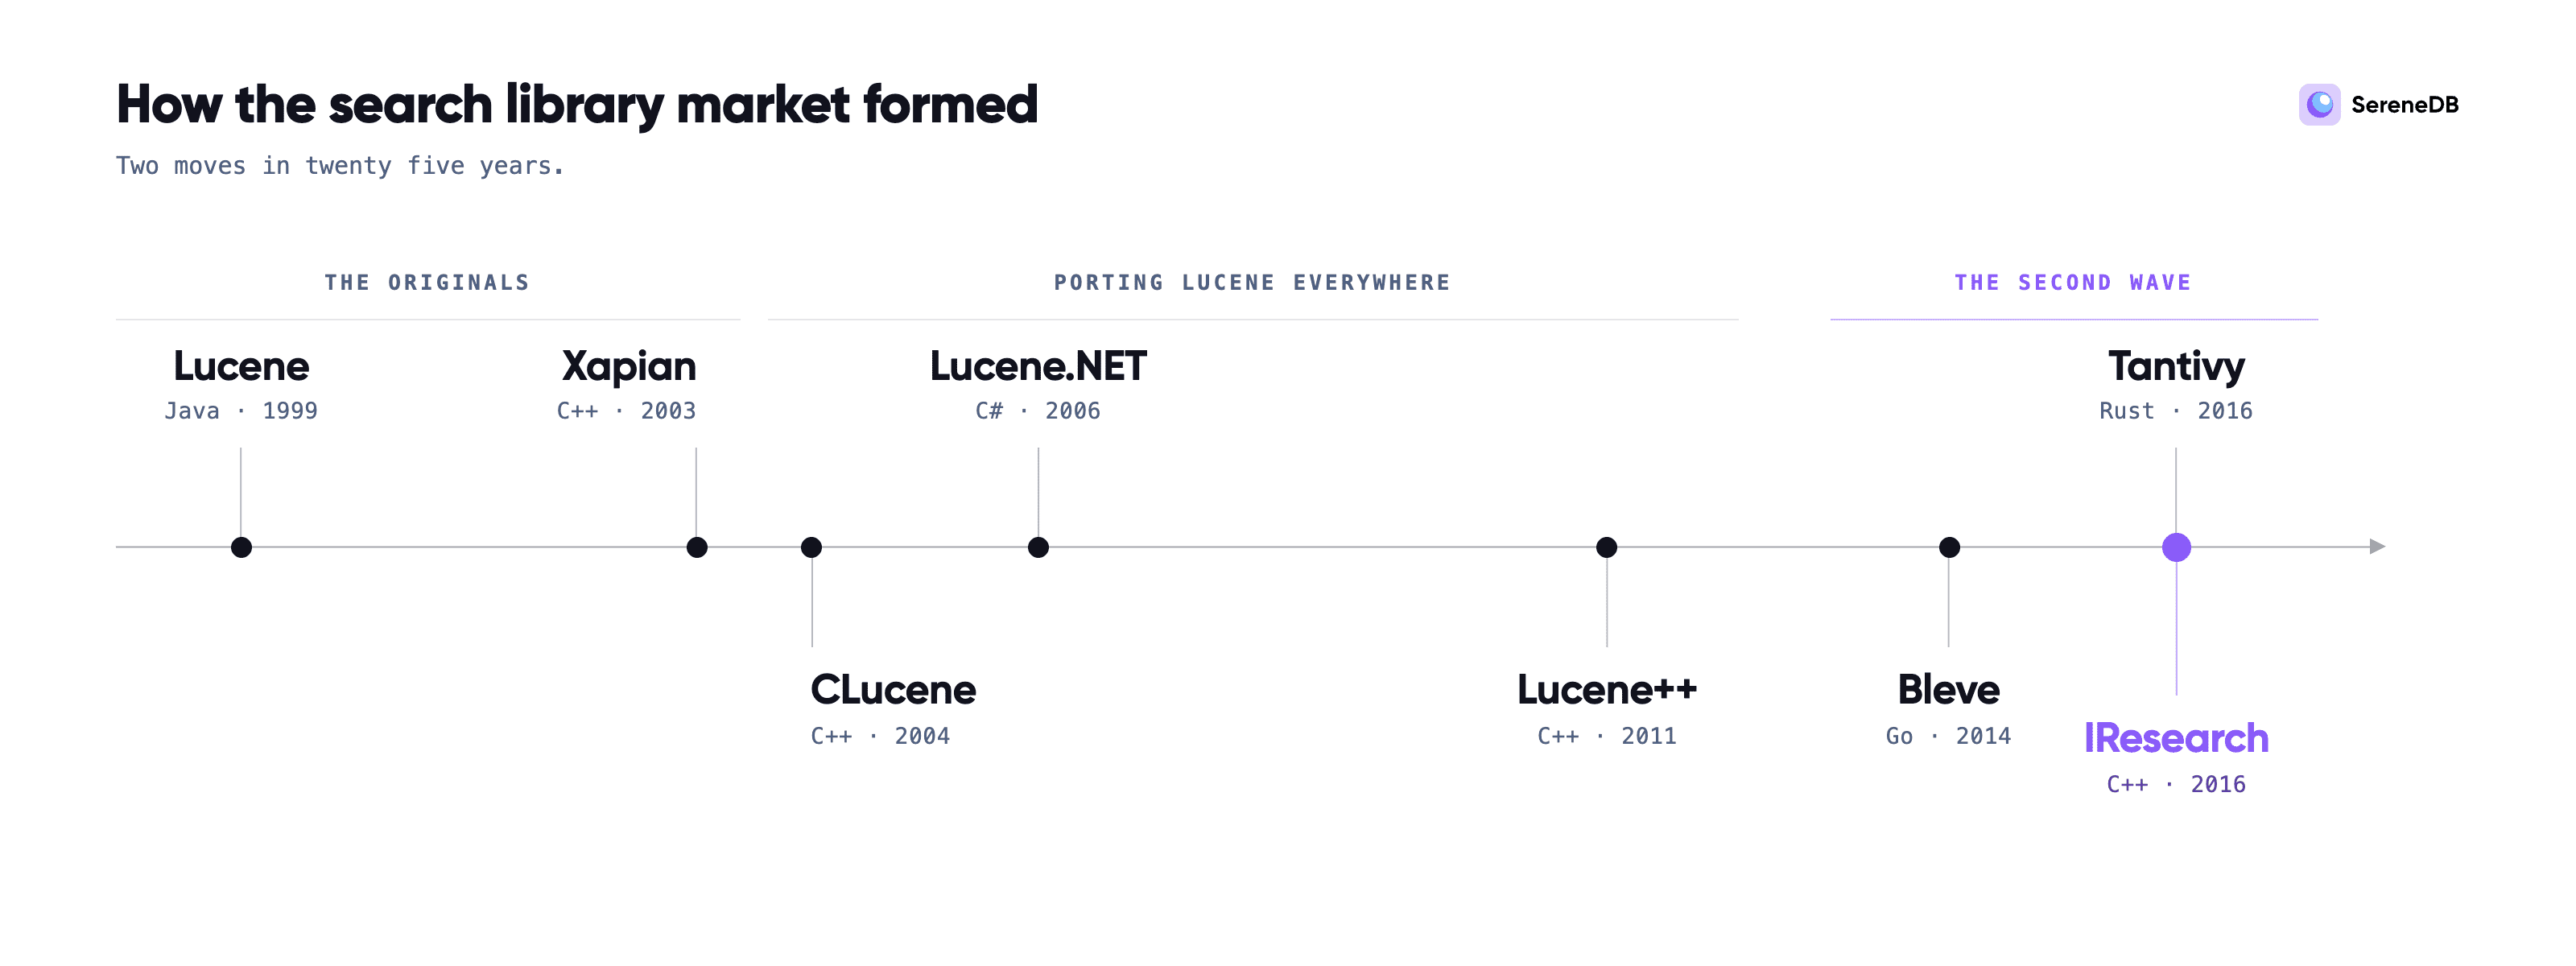
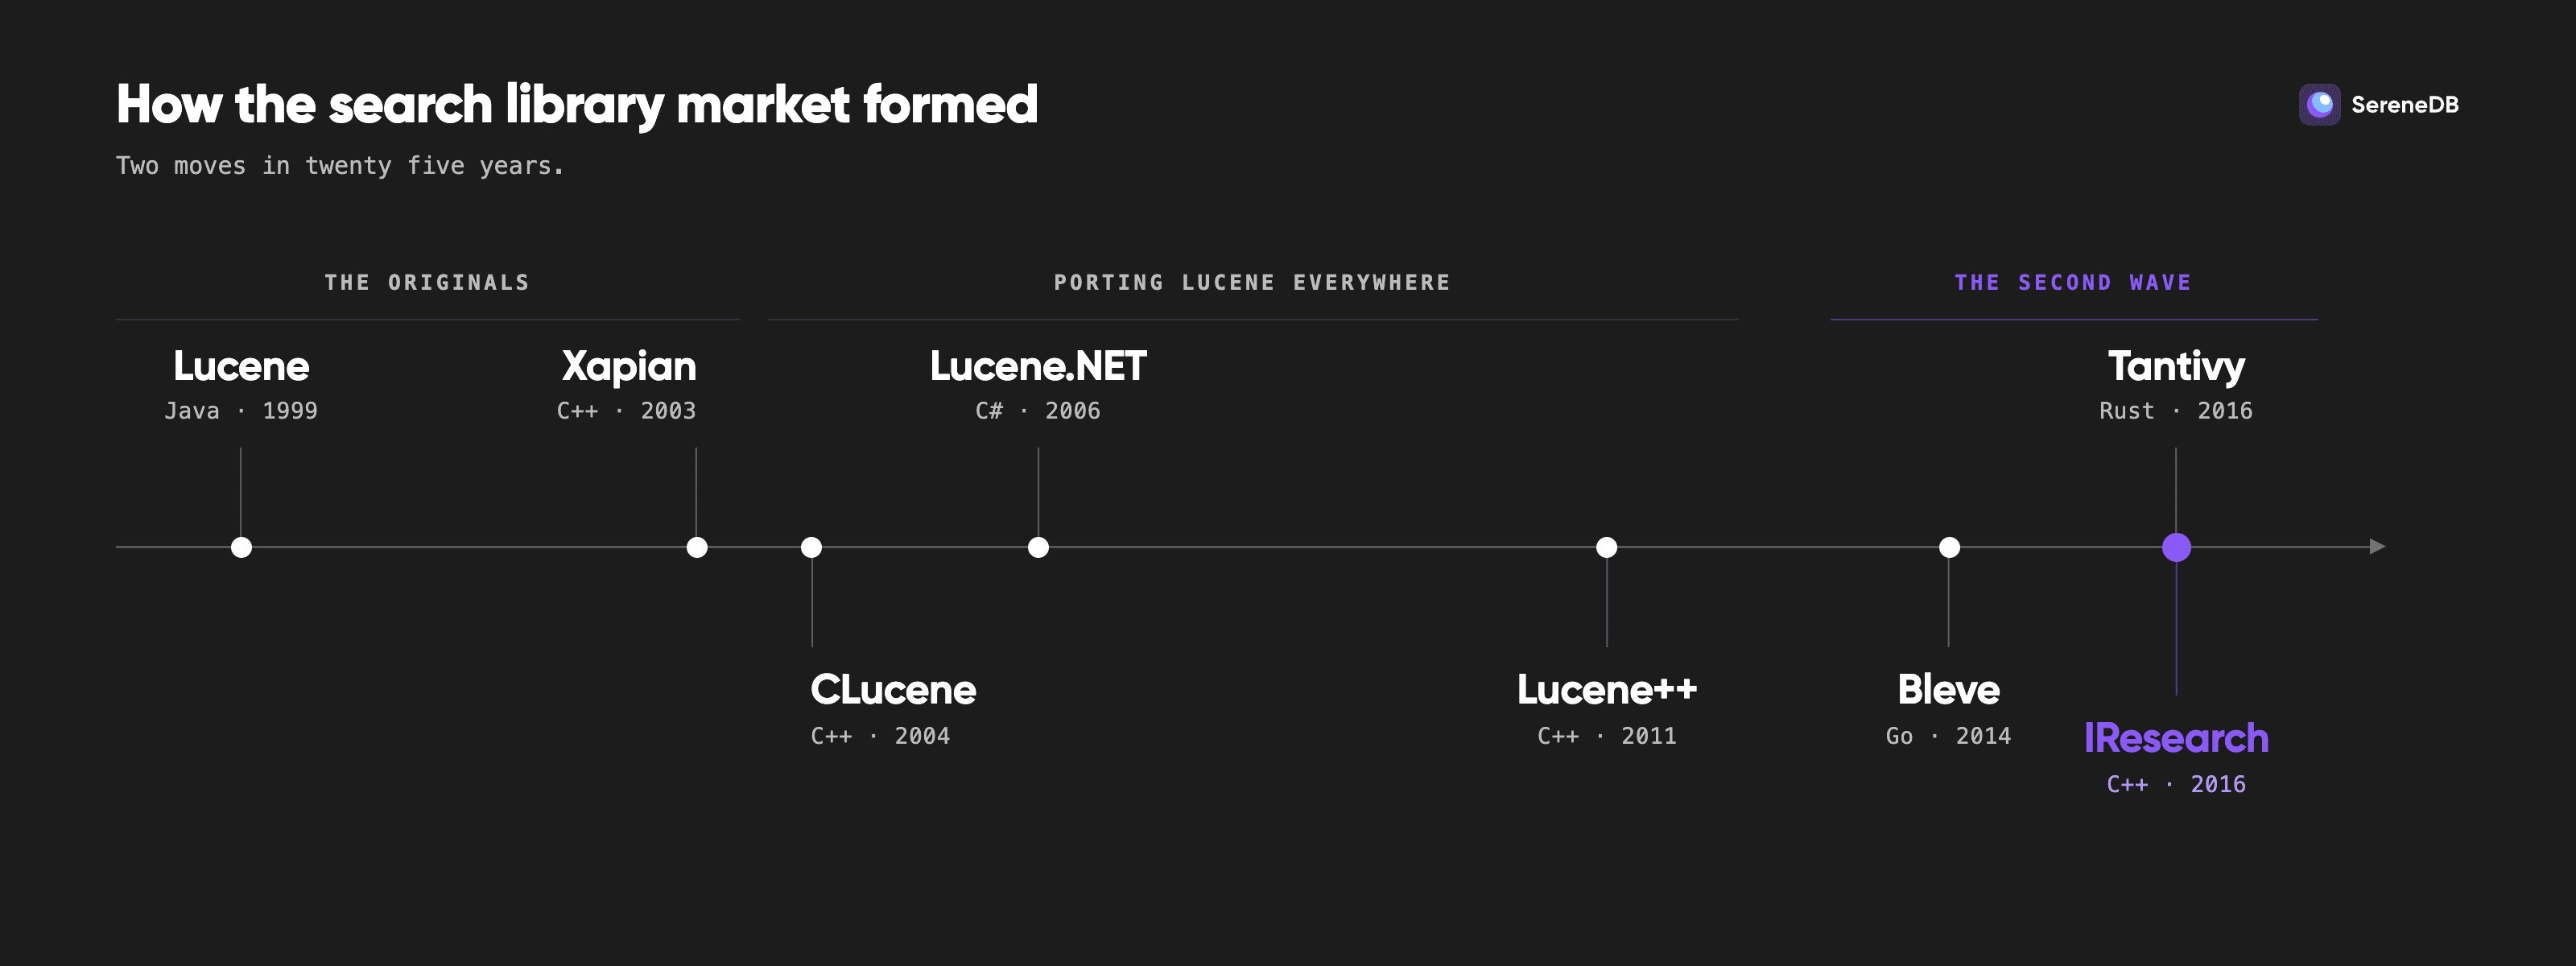
The early 2000s gave us Lucene and Xapian. Lucene won on licensing and timing. Apache 2.0 played well against Xapian's GPL and settled who could embed what into a commercial product, so Lucene landed in the Java server ecosystem.
After success, developers started porting Lucene to their languages, so we got ports like CLucene, Lucene.NET and Lucene++. They even powered real production systems for a decade but none caught up with upstream.
Around 2015 the approach changed. Instead of translating Lucene, people started asking what Lucene's architecture should look like if you designed it for a specific language from the start. Couchbase built Bleve in Go. Paul Masurel started Tantivy in Rust, which now powers Quickwit and ParadeDB. And our team started IResearch in C++, which is the engine inside SereneDB today and the one that won Search Benchmark, The Game back in March.
Chapter 2. It's a Lucene world
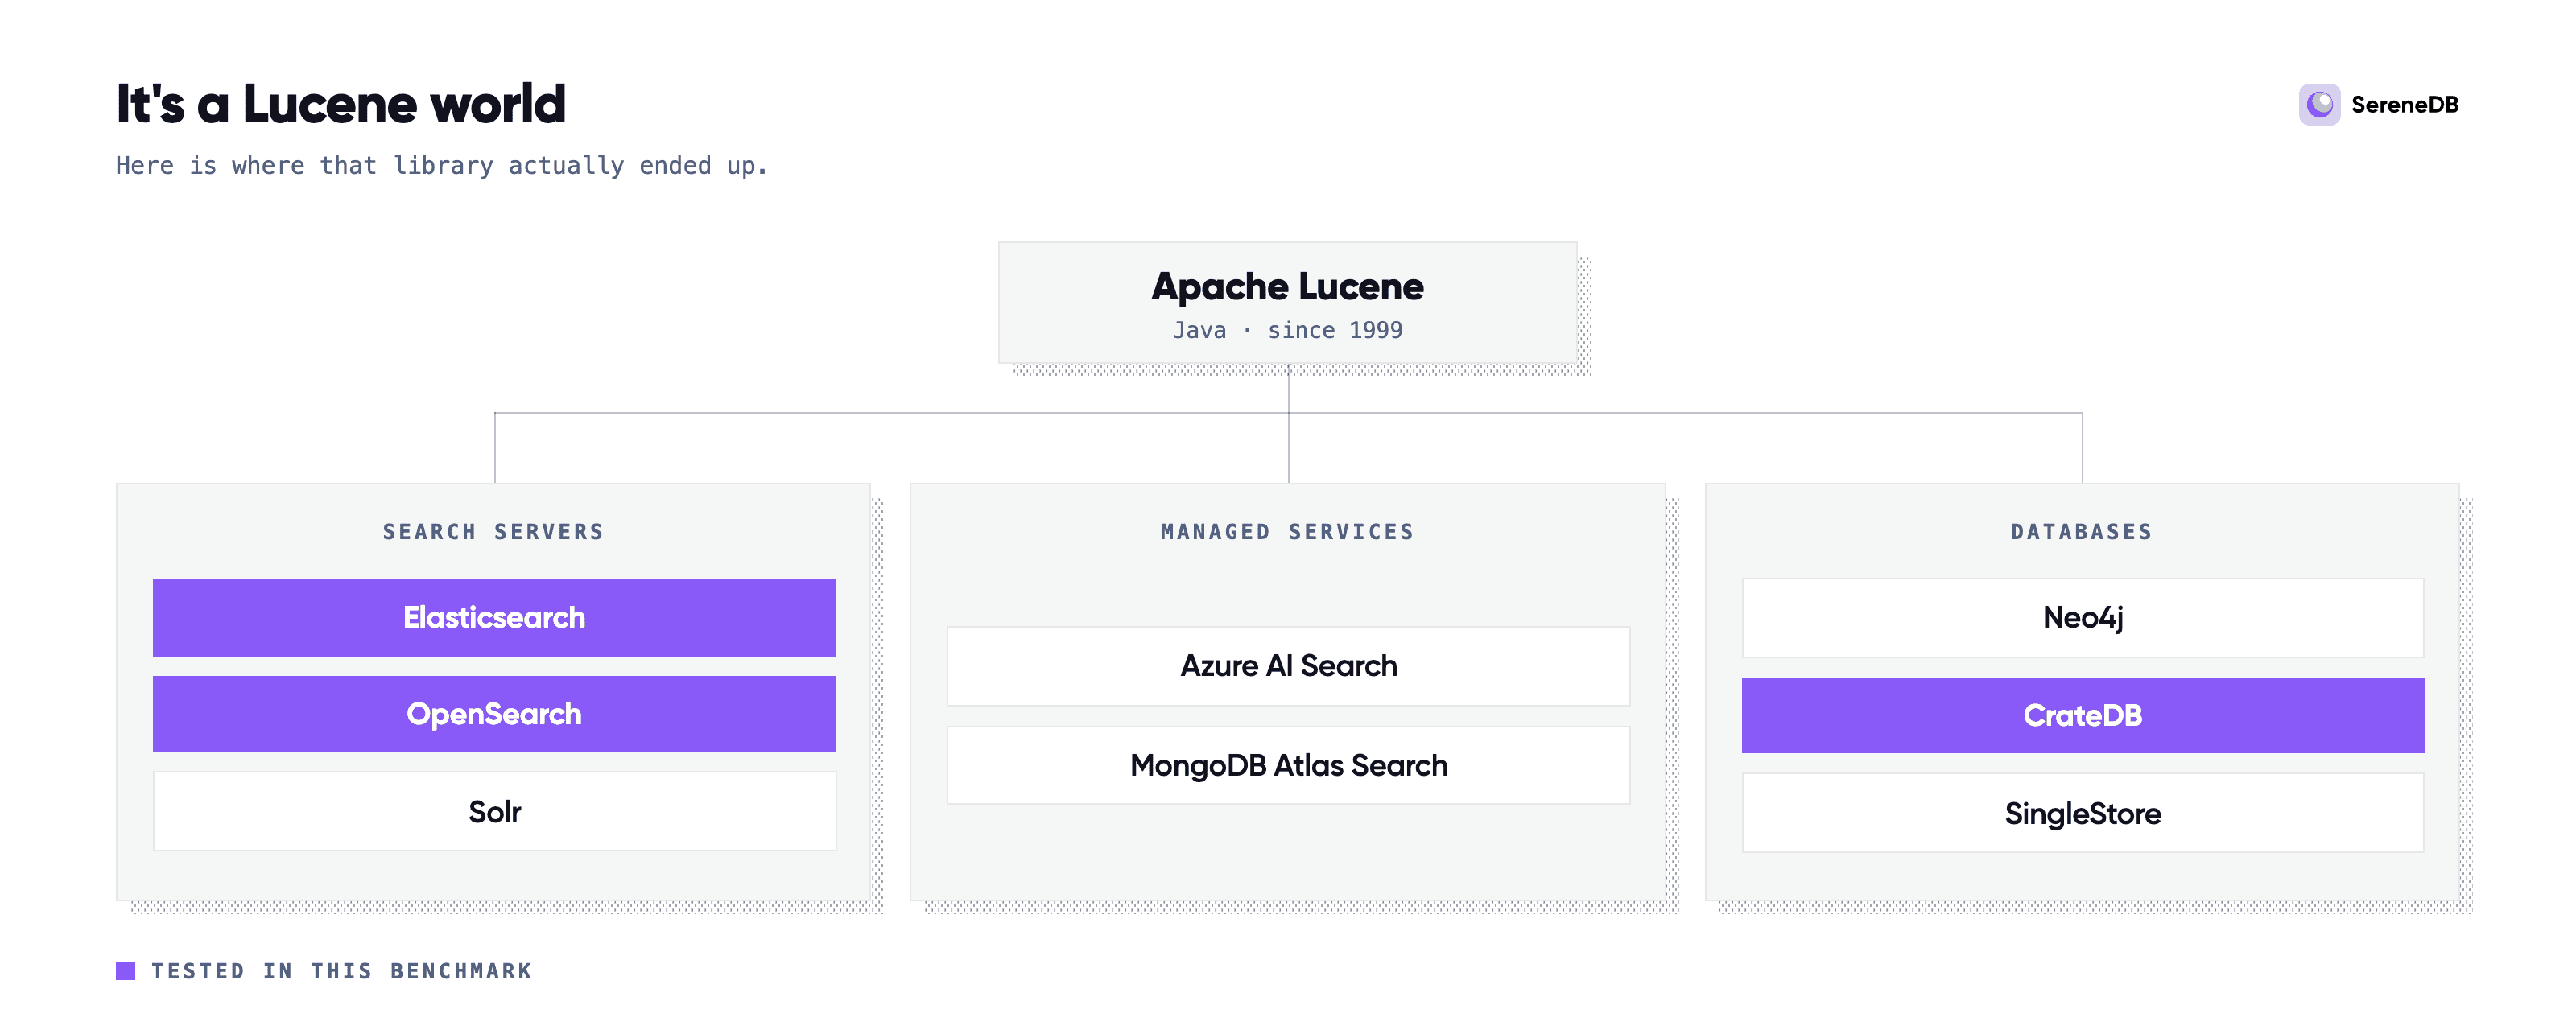
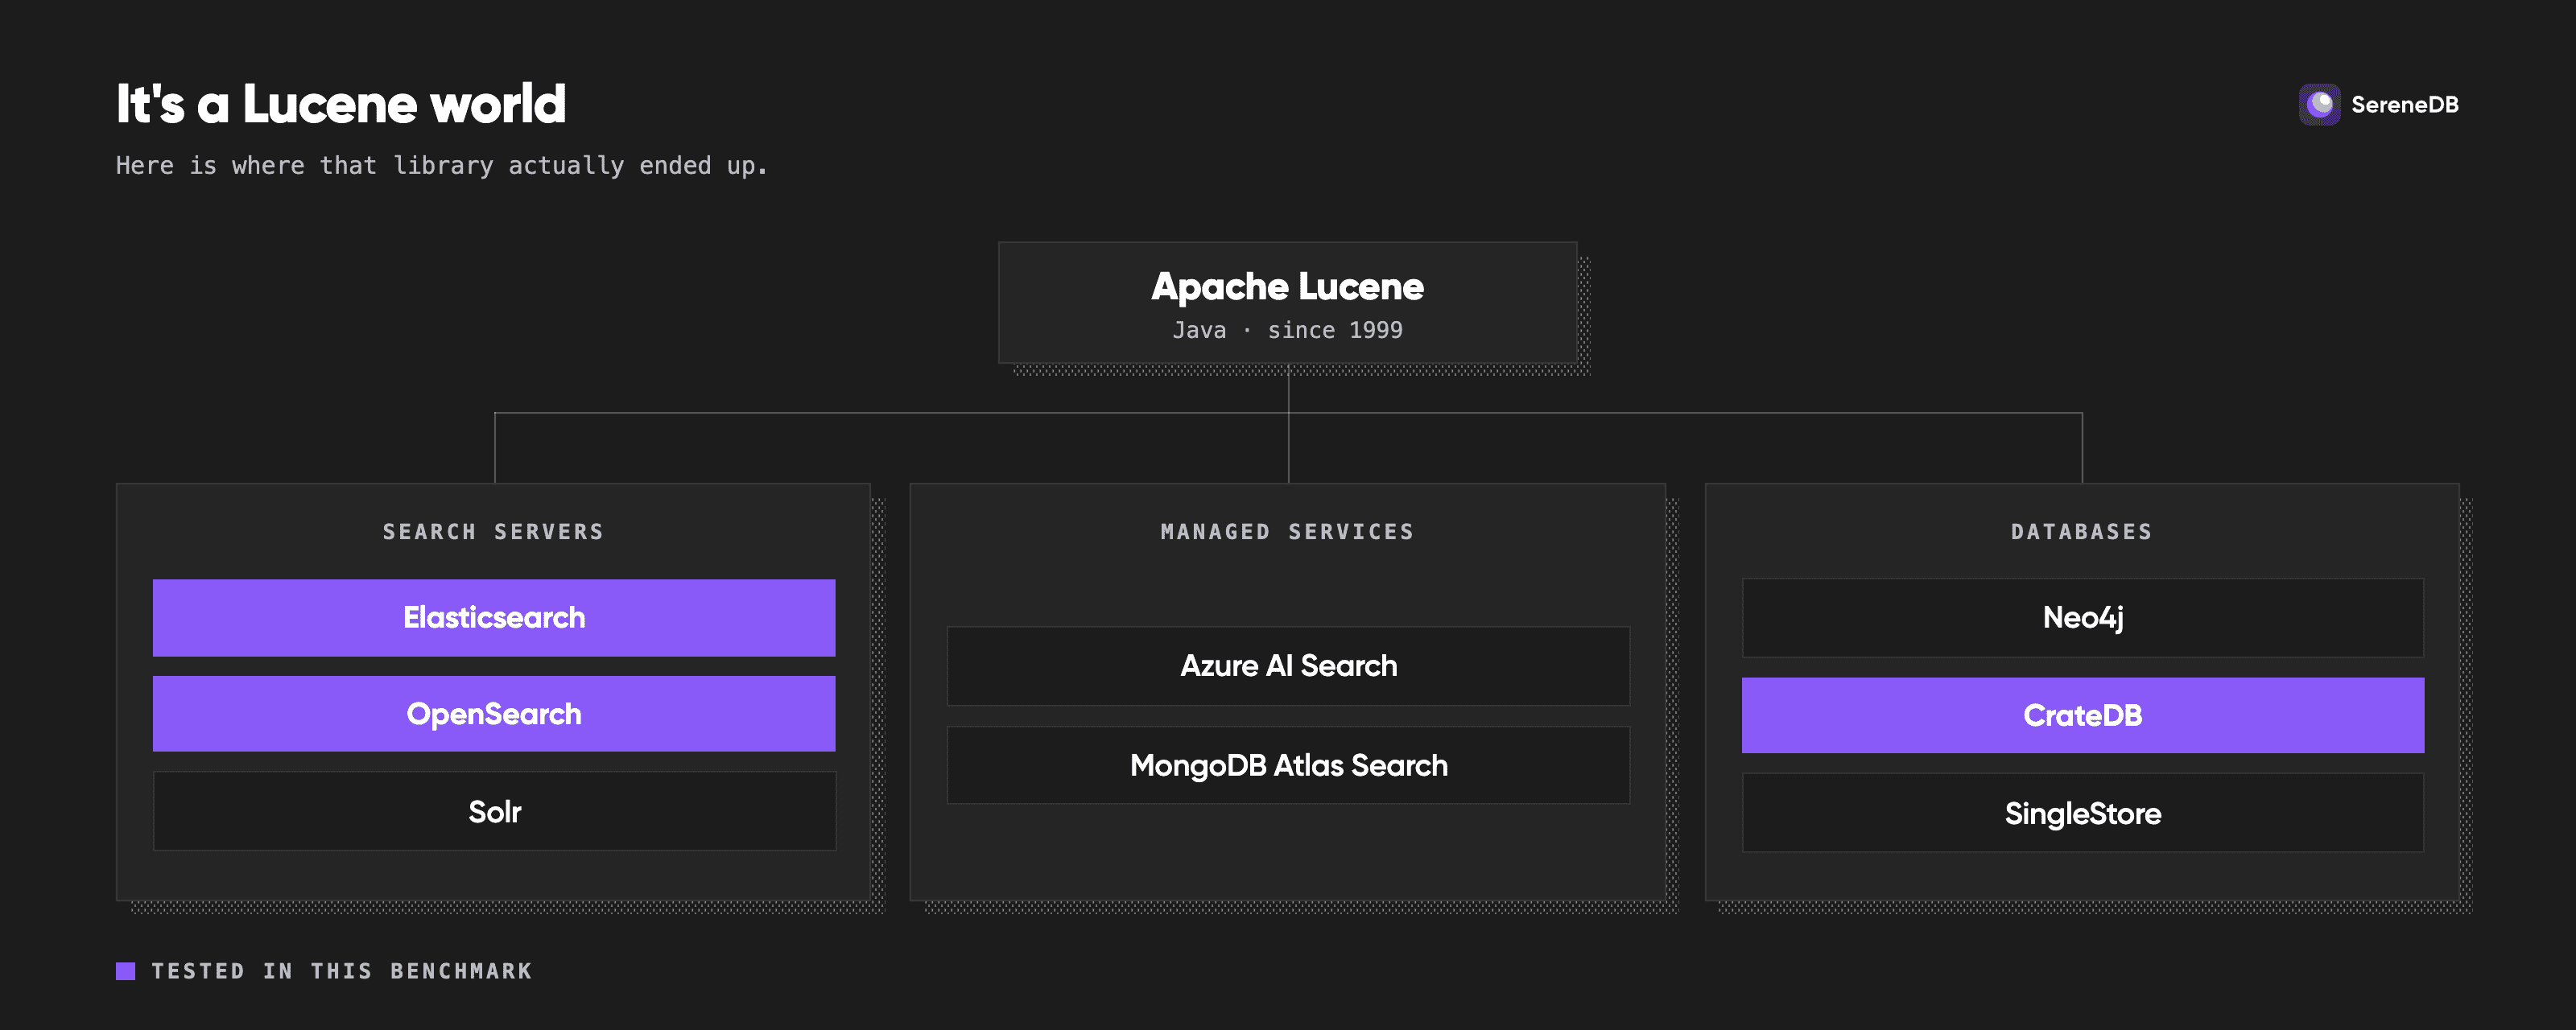
Lucene is almost everywhere. The search servers are Lucene: Elasticsearch, OpenSearch, Solr. The managed offerings are Lucene under the hood: Azure AI Search, MongoDB Atlas Search. It is inside databases too, Neo4j, CrateDB, SingleStore and basically any other Java database you can name. For the benchmarks we picked the three that interest us most:
Elasticsearch is the one everybody has run. It shipped in 2010, the company formed in 2012 and somewhere in between it became the default answer for enterprise search and log analytics. It is the reference implementation of this entire category.
OpenSearch is the fork Amazon started from Elasticsearch 7.10.2 after the license change in 2021 and since 2024 it's governed by the OpenSearch Software Foundation under the Linux Foundation. It has also drifted technically in ways worth measuring, most visibly around native code under JNI for vector search and around running a single query concurrently across segments.
CrateDB is here because its pitch is close to SereneDB. A database with Postgres compatible SQL and Lucene doing the search underneath, aimed at exactly the analytics plus search workload we built SereneDB for. So we really wanted to see the numbers.
Chapter 3. Elasticsearch 9.5, ES|QL and columnar storage
For most of its life Elasticsearch was a JSON query DSL and a set of aggregations. No joins, no real query language and if your last serious look was around 2015 then that is the Elasticsearch in your head.
- 2015, curl and the query DSL
- 2026, ES|QL
POST /otel_logs/_search
{
  "query": {
    "bool": {
      "must": [
        { "match": { "Body": "failed" } },
        { "range": { "Timestamp": { "gte": "now-24h" } } }
      ]
    }
  },
  "aggs": {
    "by_service": {
      "terms": { "field": "ServiceName", "size": 10 }
    }
  }
}
FROM otel_logs
| WHERE MATCH(Body, "failed") AND Timestamp > NOW() - 24 hours
| STATS failures = COUNT(*) BY ServiceName
| SORT failures DESC
| LIMIT 10
Elastic has added a lot of ways to query over the years and ES|QL looks like the one they are building on from here. It is a composable query language with its own planner and LOOKUP JOIN does something Elasticsearch simply could not easily do before.
The other change is storage. Elasticsearch 9.5 added a columnar index mode. Fields are stored only in a column stride fashion, with optional indexes pointing to certain records. It landed shortly after ClickHouse published TextBench, which argued Elasticsearch was expensive on disk, but it seems more like a coincidence. Either way it is new, it is interesting and nobody has published much about what it costs. So we decided to measure it.
Chapter 4. What SearchBench measures
SearchBench is our open benchmark for search and analytics, which we announced at Berlin Buzzwords and first published in July when we ran it against ArangoDB. The shape follows ClickBench, i.e. every engine implements the same seven shell scripts and a shared driver orchestrates them, so adding an engine is an afternoon of work.
We run two scales, 100M and 1B log records and measure three things at each: time to ingest and index, size on disk and the median latency across the 92 queries. Result caching is off everywhere.
Timing. Three runs per query, we report the best of the last two. Each measurement is the client round trip for one query, taken from psql's \timing on SereneDB and from curl's total time on the three engines we talk to over HTTP. We deliberately do not use the server's own reported took, because that hides serialization and transfer.
The 60 second rule. Any single query gets 60 seconds. If it does not come back in that window we record that it did not finish. There are a lot of those below and we want to be precise about what they mean: a query has been executing for more than 60s and hit the cap.
What this does not measure. One query at a time from a single client, so everything here is latency. Concurrency, ingest, updates, distribution and memory are all fair questions we don't answer.
And of course we do our best to give every engine the strongest configuration we can build for it. We will not always have managed it, which is why every adapter sits in the repo where you can check our work.
The OpenTelemetry corpus
The corpus is generated OpenTelemetry logs. We use the set published by TextBench instead of rolling our own. Every record has 15 columns describing one log message:
Timestamp | when |
TraceId, SpanId, TraceFlags | trace correlation |
SeverityText, SeverityNumber | log level, as text and as a number |
ServiceName | which service emitted it |
Body | the message itself and the only full-text field |
ResourceSchemaUrl, ResourceAttributes | what produced the log |
ScopeSchemaUrl, ScopeName, ScopeVersion, ScopeAttributes | which instrumentation scope |
LogAttributes | per-record key/values |
The three *Attributes columns are JSON maps. The database has to store all 15 columns, including the ones no query touches. That rule matters more than it sounds, because an engine that only keeps the searchable text will report a beautiful index size and then be useless for actually reading your logs.
The 92 queries
92 of them, in five families:
| family | what it is |
|---|---|
count | how many logs match |
top_k (bm25) | top 100 ordered by relevance, BM25 scored |
group_by | matches bucketed by service or by time |
top_k (time) | top 100 ordered by timestamp, newest first, which is log tailing |
join | correlate two services through a shared trace id |
Two of those five are top 100 problems and they differ only in the ordering key: top_k (bm25) ranks by relevance, top_k (time) ranks by timestamp. Keeping them apart matters, because the two get answered by completely different machinery.
Each family is then crossed with how you are asking: single term, conjunction, disjunction, minimum should match, phrase, phrase with proximity, prefix, regexp, wildcard, fuzzy, negation and time windows. Then we cross that again with how common the word is, because searching for something that shows up in 40% of your logs is a completely different job from finding one that shows up in 0.001%.
Chapter 5. How we configured each engine
The machine
One GCP n2-standard-32, so 32 vCPUs of Intel Ice Lake at 2.6 GHz and 128 GB of RAM, running Ubuntu 24.04.4 LTS on a 3.9 TB pd-ssd. One instance of each engine, no clustering and no sharding anywhere.
| engine | version | image |
|---|---|---|
| SereneDB | 26.09.1 | serenedb/serenedb:26.09.1 |
| Elasticsearch | 9.5.0 | docker.elastic.co/elasticsearch/elasticsearch:9.5.0 |
| OpenSearch | 3.8.0 | opensearchproject/opensearch:3.8.0 |
| CrateDB | 6.4.1 | crate:6.4.1 |
What each engine got
Every engine stores all 15 columns and indexes exactly one text field. Body is tokenized the same way everywhere: split on runs of whitespace, punctuation and symbols, then lowercase, with no stemming and no stopword removal. Here is where they differ.
| engine | index | settings |
|---|---|---|
| SereneDB | search table on IResearch, inverted(Body en) | frequency, norm and position on, optimize_top_k = 'bm25(1.2, 0.75)' |
| Elasticsearch | one index, Body as text, keywords with norms off, index: false on the columns nothing searches | refresh_interval 30s, best_compression, both caches off |
| Elasticsearch columnar | "mode": "columnar", Body as text, keywords with norms off, index: false on the columns nothing searches | refresh_interval 30s, best_compression, both caches off |
| OpenSearch | one index, Body as text, keywords with norms off, attribute maps as object with enabled: false | refresh_interval 30s, best_compression, both caches off, concurrent_segment_search.mode: all |
| CrateDB | FULLTEXT plus plain index on body, four shards | refresh_interval 30000, best_compression, max_clause_count 65536, ANALYZE after ingest |
Keeping index: false on the unsearched columns leaves their doc values in place, so they still aggregate without paying for postings.
refresh_interval is the one setting we raised everywhere, from a default of one second to thirty. A refresh opens a new searchable segment, so refreshing once a second through a bulk load buries the engine in tiny segments and the merge work that follows.
ANALYZE is CrateDB's documented post-import step. It builds the statistics its planner reads, and without it all 92 queries get planned blind.
Both Elasticsearch configurations get a lookup index we built for them. Elasticsearch cannot join an index to itself and LOOKUP JOIN needs the right hand side in a dedicated lookup mode index, so we built one: a document per trace id, three precomputed boolean flags, pruned to traces that touch a service the joins care about. The columnar adapter builds the same one.
Elasticsearch is measured through two interfaces. Q01 to Q83 go through _search because the DSL measured about twice as fast as ES|QL. The nine joins go through ES|QL because the DSL cannot express them. Chapter 8 is the full comparison.
body keeps its plain index to work around a ~ bug. On 6.4.1 body ~ pattern returns zero rows against an INDEX OFF column and raises no error, while LIKE and MATCH on that same column are fine. Two queries use ~, so body keeps its default plain index next to body_ft. CrateDB has fixed this class of problem for other operators before.
CrateDB's fulltext index cannot do substring matching. MATCH offers best_fields, most_fields, cross_fields, phrase and phrase_prefix, there is no regexp type and it never interprets wildcard metacharacters. Token prefix is as far as body_ft goes, so the mid-word, suffix and infix patterns scan the column instead. Two of them hit the 60 second cap at a billion.
CrateDB's clause ceiling is raised to 65536. Fifteen queries use phrase_prefix with max_expansions = 50000 so the counts match Elasticsearch exactly. At a billion rows the conn and charg prefixes expand past Lucene's 8192 default and six queries die with TooManyClauses and the driver records a null. Nothing surfaces as an error. The ceiling has to be a node flag because the setting is static.
Where the dialects do not line up
Not every engine can express every shape in the grid. Where one cannot, we wrote the closest thing that returns the same rows and listed it here. Nothing was quietly dropped.
| shape | SereneDB | Elasticsearch | OpenSearch | CrateDB |
|---|---|---|---|---|
| minimum should match | ts_any([...], 2) | minimum_should_match | minimum_should_match | OR over every 2-subset |
| prefix | ts_starts_with | prefix, or QSTR in ES|QL | prefix | phrase_prefix with max_expansions |
| regexp | ts_regexp | regexp, or QSTR in ES|QL | regexp | ~ operator |
| infix wildcard | ts_like | wildcard | wildcard | LIKE '%nnec%', whole string scan |
| fuzzy | ts_levenshtein | fuzzy, or QSTR in ES|QL | fuzzy | WITH (fuzziness = 2) |
| relevance score | BM25() | _score | _score | _score |
| join | native | second index plus LOOKUP JOIN | not expressible | native SQL self-join |
ES|QL has no first-class regexp, prefix, fuzzy or wildcard function, so all four go through QSTR(), which is the query_string parser. The DSL has proper operators for each.
CrateDB ignores minimum_should_match, silently. Asking for two of four terms returned the plain OR count, 30,112 against Elasticsearch's 17,939, so the adapter expands it into an OR over every two element subset, which reproduces Elasticsearch exactly.
CrateDB has no index-backed form for infix and suffix patterns, so those stay whole string scans. That is CrateDB's limit. We did not choose it. LIKE is not a substitute for a prefix either and it is worth seeing why: Elasticsearch's prefix matches any token starting with conn, while LIKE anchors on the whole log line. At a billion rows body LIKE 'conn%' returns 0 and body LIKE '%conn%' returns 19,447,319 against Elasticsearch's 19,554,788, untokenized and case sensitive. Fast, confident and wrong.
ES|QL's COUNT_DISTINCT is HyperLogLog++ and approximate, where everything else here counts exactly. The joins run STATS BY TraceId | STATS COUNT(*) instead, which is exact and costs the same, 66.9 s against 67.2 s at a billion. All nine then return the same number as SereneDB at 100M, to the row.
Chapter 6. Load time and index size
100M logs
1B logs
Load is the one place nobody is close. At 100M the next fastest after SereneDB is OpenSearch at 21x its time, then Elasticsearch at 24x, columnar at 26x and CrateDB at 45x. At a billion they bunch up between 30x and 33x with CrateDB at 53x. The three Lucene servers all ingest through HTTP bulk requests while we read the parquet in process and that is a real part of the gap.
Elasticsearch in columnar mode draws level with SereneDB at a billion, 112.0 GiB against 112.1. That is the closest anyone gets to us on disk. At 100M the same mode lands at 15.5 GiB against our 11.2, so the saving it buys at a billion is not there at the smaller scale.
The rest of the field lands where you would expect. OpenSearch is 1.22x SereneDB at a billion, Elasticsearch 1.37x and CrateDB 1.70x. At 100M CrateDB is the largest of the lot at 30.9 GiB.
Chapter 7. Ninety two queries at 100M and 1B
100 million logs
Count, rank and group
Tail and correlate
Two kinds of bar need explaining and they mean different things. A bar marked > 60 s is a family whose median query hit the cap. We draw it clipped, just above the tallest bar we could measure, because its real height is unknown and drawing it at exactly 60 seconds would both claim a number we do not have and flatten every other bar in the group. Those bars understate the gap. A bar marked n/a is a family the engine has no syntax for, so there is nothing to draw. OpenSearch did not time out on a single query at either scale. Its slowest query at a billion rows is 6.0 seconds. Its nine missing joins are missing because the _search DSL has no join and we come back to that below.
Across all 92 queries the median is 13.0 ms for SereneDB, 41.7 ms for Elasticsearch, 68.1 ms for Elasticsearch in columnar mode and 60.1 ms for CrateDB. OpenSearch answers its 83 at a median of 47.6 ms.
Completions inside the cap: 92 of 92 for SereneDB, 92 for both Elasticsearch configurations, 87 for CrateDB and 83 of the 83 OpenSearch attempted.
| engine | its median on the queries it finished | SereneDB on that same subset |
|---|---|---|
| Elasticsearch | 41.7 ms on 92 | 13.0 ms |
| Elasticsearch columnar | 68.1 ms on 92 | 13.0 ms |
| OpenSearch | 47.6 ms on 83 | 12.0 ms |
| CrateDB | 53.2 ms on 87 | 12.0 ms |
The median per query ratio against SereneDB is 2.75x for Elasticsearch, 3.97x for columnar, 3.43x for OpenSearch and 4.87x for CrateDB. We are faster on 83 of 92 against Elasticsearch, 86 against columnar, 79 of the 83 shared with OpenSearch and 84 against CrateDB.
One billion logs
Count, rank and group
Tail and correlate
Across all 92 queries the median is 32.5 ms for SereneDB, 98.4 ms for Elasticsearch and 543.5 ms for CrateDB. OpenSearch answers its 83 at 195.2 ms.
| engine | its median on the queries it finished | SereneDB on that same subset |
|---|---|---|
| Elasticsearch | 85.6 ms on 88 | 32.0 ms |
| Elasticsearch columnar | 161.1 ms on 90 | 32.0 ms |
| OpenSearch | 195.2 ms on 83 | 29.0 ms |
| CrateDB | 428.5 ms on 81 | 29.0 ms |
The median per query ratio against SereneDB is 3.87x for Elasticsearch, 5.75x for columnar, 6.64x for OpenSearch and 9.08x for CrateDB. We are faster on 83 of 92, 90 of 92, 81 of the 83 shared with OpenSearch and 91 of 92 against CrateDB.
OpenSearch only ran 83 of the 92. It answered all 83 at both scales, so the flat bar means it never failed one. Everyone else ran all 92.
Elasticsearch loses four queries at a billion and columnar loses two, all of them joins. CrateDB drops from 87 to 81. We answer all 92 at both scales.
What grows and what doesn't is the interesting part. Ten times the data costs SereneDB 2.4x on count, 1.8x on top_k (bm25) and 2.0x on top_k (time), which is well under linear. group_by costs 7.1x and joins 9.8x and those two are the honest weak spots. Load scales 8.6x and disk 10.0x, so the footprint tracks the corpus almost exactly.
SereneDB's slowest query of the 92 is a join at 2.8 seconds. Drop the joins and the median across the other 83 is 29 ms at a billion rows.
Joins across services
This is the widest gap in the post and it is also the one that needs the most care, because two of the four configurations here cannot express the family at all.
All nine joins finish for SereneDB at both scales, 198 ms median at 100M and 1.93 s at a billion. Elasticsearch answers them only because we built it a lookup index from the parquet and even with that help it lands at 1.59 s at 100M and 35.58 s at a billion with four of the nine hitting the cap. The columnar index does better at 24.63 s with two caps. CrateDB expresses all nine in plain SQL and finishes none of them at a billion. OpenSearch's _search DSL has no join at all.
Chapter 8. ES|QL against the query DSL
Measuring one engine through two query languages doubles its columns, so this chapter is where the other three Elasticsearch configurations live. Everything below compares the 83 non-join queries, because the nine joins run through ES|QL in both files.
ES|QL has a fixed setup cost and it is large. Split the queries by how expensive they are in the DSL and the pattern is unmistakable.
| row store, 1B | DSL median | what ES|QL adds | ratio |
|---|---|---|---|
| cheapest quarter | 27.6 ms | +55.3 ms | 2.74x |
| middle half | 74.3 ms | +20.5 ms | 1.23x |
| dearest quarter | 569.6 ms | −185.5 ms | 0.66x |
The absolute penalty stays roughly flat while the ratio collapses from 2.7x to below 1. That is a fixed cost per query and it shows up as a floor too: the fastest ES|QL query anywhere is 29.7 ms at a billion against the DSL's 10.6 ms and 11.8 ms against 4.5 ms at 100M. On genuinely expensive queries ES|QL wins outright, because whatever it pays up front it makes back in execution.
Which interface is faster depends on the query. By family at a billion on row storage, count costs 42.5 ms in the DSL against 125.2 ms in ES|QL and ES|QL wins only 9 of the 32. top_k is 57.7 against 75.3. group_by is about the same, 230.5 against 233.0. recent flips the other way, 104.0 in the DSL against 80.0 in ES|QL. Counting is where ES|QL is weakest and log tailing is the one family where it is reliably ahead.
On the columnar index the two interfaces converge. At a billion rows the columnar index answers at 113.5 ms through the DSL and 136.1 ms through ES|QL and the deltas across those three cost buckets are +0.6 ms, then −0.3 ms, then +0.7 ms. That is nothing at all. The floors converge too, 10.4 ms against 10.1 ms, where on the row index they sit at 10.6 against 29.7. Whatever ES|QL is paying up front on row storage it is not paying here and per family the pair is within noise everywhere: count 48.2 against 48.4, top_k 68.2 against 63.6, group_by 6168.1 against 6144.2 and recent 329.6 against 327.1.
The 100M columnar run still shows the row store shape, ES|QL costing +9.8 ms on the cheapest quarter and saving 229.6 ms on the dearest.
| configuration | DSL | ES|QL | best of both, per query |
|---|---|---|---|
| row, 100M | 25.8 ms | 32.4 ms | 24.9 ms |
| row, 1B | 74.3 ms | 121.8 ms | 66.6 ms |
| columnar, 100M | 42.1 ms | 32.7 ms | 29.1 ms |
| columnar, 1B | 113.5 ms | 136.1 ms | 113.5 ms |
That last column is the practical takeaway. Routing each query to whichever interface handles it better beats either interface used alone on the row index at both scales. On the columnar index at a billion it buys nothing, because there is nothing left to arbitrage. It is also what our adapter already does, which is the answer to anyone who suspects we picked whichever Elasticsearch looked worst.
The surface is worth a word too. ES|QL is a second full query language with its own planner and its coverage differs from the DSL. regexp, prefix, fuzzy and wildcard have no first-class form and all go through QSTR(). LOOKUP JOIN exists only in ES|QL. If you are migrating, neither interface is a superset of the other yet.
Chapter 9. Don't trust us, run SearchBench yourself
We want you to run it yourself and everything you need is in the repo. Testing it yourself is just a matter of executing a tiny shell command.
git clone https://github.com/serenedb/searchbench
cd searchbench/elastic # or elastic-columnar, opensearch, cratedb, serenedb
SEARCHBENCH_DATA_DIR=/path/to/data SEARCHBENCH_DATASET=otel_logs_100m ./benchmark.sh --index
Think we tuned something wrong or you would have built a different index? Does a newer release change the picture? Open a PR against the adapter and we'll rerun it and republish. Everyone in this field is guessing about everyone else's engine. The only way out of that is to compare notes properly.
Chapter 10. What the Lucene world got right
Lucene has been the right answer for twenty five years and this benchmark shows why. Elasticsearch ranks a top 100 over a billion rows in 57.7 ms, and it is the closest anyone has come to SereneDB on group_by at that scale so far. Elastic shipped a real query language in ES|QL and LOOKUP JOIN is the only reason the join family runs on a search server at all. It also added a storage mode that draws level with SereneDB's footprint at a billion rows. OpenSearch answered every single query it can express without one timeout at either scale. CrateDB put all of it behind Postgres SQL, which is a genuinely hard thing to do.
We have now put SereneDB against ArangoDB, against the Postgres family and against the Lucene world. Elasticsearch is the strongest competitor of so far. It is good at search, it does analytics as well and the columnar index mode is a real start on the storage side. OpenSearch stays a very good search tool. CrateDB has the right idea and its numbers are still a long way from the rest of the field.
Nobody in any of those three posts has come close on search and analytics together. Underneath ours is IResearch, the engine that won Search Benchmark, The Game, sitting on a columnstore with a vectorized executor above it, so a join runs as a join and a GROUP BY runs as an aggregation.
You should not need a search engine sitting next to a warehouse with a glue layer keeping the two in sync. That is the whole bet behind SereneDB: one system holding your indexes, the columnstore and an executor that knows about both.
The easiest way to disagree with any of this is to run it.
docker run -d --name serenedb -p 7890:7890 serenedb/serenedb
That is the whole install, and the quick start takes it from there. Point it at your own data. If your results look different, open an issue and show us.
If you find this interesting, we'd be grateful if you support SereneDB with a star on GitHub. For an early-stage project, it means more than you might think.
Other SearchBench write-ups: